Ghidra Extension Development
Development Setup and Troubleshooting

As we didn’t want to use Eclipse for Ghidra extension development and Eclipse sometimes didn’t work out of the box either as we wanted it to, this blog post covers some of the things we tried that might be obvious to others, but haven’t been previously documented as such.
Copying the Skeleton Project
The first step in development is locating the root folder of your
Ghidra installation. This is the folder where
ghidraRun/ghidraRun.bat is located and in the following referred to
as the environment variable GHIDRA_INSTALL_DIR. The folder
$GHIDRA_INSTALL_DIR/Extensions/Ghidra/Skeleton contains the template
for a Ghidra extension, including examples for several different types
of extension points, e.g. analyzers or exporters. You can copy this
folder and rename it to the preferred name of your extension. For the
sake of this blog post, we are going to name it MyExtension.
As a side-note, it’s important to remember that most of this is not necessary if you just want to write a simple Ghidra script. Ghidra supports scripting in
PythonthroughJython. However, this comes with its limitations such as having to use Python 2, not being able to install dependencies and missing out on the Java extension points, likeanalyzersorexporters. There are projects which try to alleviate these shortcomings, like Ghidra Bridge and Ghidrathon, which come with their own pros and cons.
Ghidra development outside of Eclipse works just through gradle. When
using gradle, you need to specify the GHIDRA_INSTALL_DIR either as an
environment variable or as a gradle property, e.g. building the
extension with the following (assuming a Ghidra installation at
/opt/ghidra):
gradle -PGHIDRA_INSTALL_DIR=/opt/ghidra
This executes the buildExtension gradle task and ultimately creates a
distributable zip-file of your extension in the dist folder (which
you can release and then install in the Ghidra project window through
File/Install Extensions. This is also the way to go when you pull an
extension from Github that wasn’t released for your current Ghidra
version; just pull the repo and use the above gradle command to build
the extension against your local Ghidra installation.
This is pretty straightforward, but when you have multiple Ghidra
installations on your system and use IDEs, e.g. IntelliJ IDEA, this
might require a bit more work. Our case was the following: We have one
main Ghidra install pointed to through the GHIDRA_INSTALL_DIR
environment variable and other Ghidra installations for development.
However, when we use the default build.gradle file from the skeleton
project, the value from the environment variable has priority over the
gradle property. Which setting you want is a matter of taste and
workflow; for us personally, it was nicer to take the
GHIDRA_INSTALL_DIR from the gradle properties with precedence (which
hopefully doesn’t break anything elsewhere). This allows us to specify
the property in a gradle.properties file and have it set by IntelliJ
IDEA when importing the gradle project:
GHIDRA_INSTALL_DIR=/opt/ghidra
Following up on how to use the project in IntelliJ IDEA (which we
mainly use for development), we also added the following lines to our
build.gradle:
// Exclude additional files from the built extension
// Ex: buildExtension.exclude '.idea/**'
buildExtension.exclude '.idea/**'

// Add the ghidra_scripts dir to the java sources
sourceSets.main.java.srcDirs += ['ghidra_scripts']
The first line is just what is recommended by the comments in the
original build.gradle file from the skeleton project. The second line
adds the ghidra_scripts folder to the set of source directories.
This results in IntelliJ giving us code completion within the
ghidra_scripts folder as well, which wouldn’t work otherwise.
At this point, it is worth noting that there are existing (at least one) plugins which should take care of the heavy lifting in IntelliJ, namely this one. However, it hasn’t been kept up-to-date now for half a year, and we wanted a solution that wouldn’t rely on additional plugins.
Ghidra Run Script and Log Output
Before we dig further into extension development, a few things on
how Ghidra is started, which might ease debugging when running into
issues later on. On Linux, Ghidra is started through the ghidraRun
script, which lives in the root folder of your Ghidra installation.
This is a shell script that basically delegates the startup to
another shell script support/launch.sh. When taking a closer look,
we are presented with the options that can be passed to this launch
script, such as the mode (fg, bg, debug, debug-suspend), name
of the application and more. For the purpose of our development, we
started Ghidra using debug (which will print the log4j debug
output to the console) and then looked at the created process to get
the full arguments that are passed to Java, resulting in the following
script to start Ghidra (we named it run.sh):
|
|
Now this isn’t strictly necessary, but it allows us to change the
classpath later on, which we can’t easily change through the launch
script alone, so we’re launching the Java main program directly.
Another setting worth checking out is the support/debug.log4j.xml
file, which specifies the log4j log levels (towards the end of the
file):
|
|
Some information that is relevant to us, e.g. whether our extension
classes are loaded correctly, is only printed on the TRACE log level,
so you can try setting the levels that are marked as DEBUG here to
TRACE if the functionality you implemented does not show up in
Ghidra itself. With that, we should be sufficiently set up to continue
to dive into our extension project.
Extension Points
When extending Ghidra, there’s different extension points where we
can plug in our own code. The most straightforward way to extend Ghidra
is through Ghidra scripts. These are technically not an extension
point in the actual sense and also doesn’t need to be within an
extension project altogether (they can be written completely
independently in Java or in Python). However, keeping them within an
extension has the advantage of being able to use dependencies for heavy
lifting or reusing code between scripts. Within the decompiler view,
the scripts can be accessed through Window/Script Manager, showing
you this overview:

This gives you a list of all currently loaded scripts, with the ability
to filter for them and add new scripts. When you build the
distributable zip of your extension and install it, your scripts will
be listed here automatically. In order to load your extension scripts
for development, you need to click on the icon highlighted within the
red circle on the screenshot and then use the green plus symbol in
the following dialog to add the path to your ghidra_scripts folder
in the extension directory as a bundle (and activate it by clicking
the checkbox to the left of its name). You can then use the icon with
the green arrows to reload your scripts, and you need to do this
every time you add new scripts, as they won’t show up in the manager
otherwise.
Once the scripts are visible in the manager, it is no longer necessary
to manually reload through the manager, as the script will be
recompiled every time it’s executed and your changes are visible
immediately. To avoid clicking into the script manager for reloading,
you can use the key icon within the script manager or assign a
keybinding in the script directly using the //@keybinding annotation.
This way, scripts allow you to extend Ghidra in a fast-paced manor, as
the script is basically “hot-reloaded”. For the other extension points
it’s unfortunately not that straightforward, as they generally require
at least a Ghidra restart. This includes the following extension
points, which are part of the Ghidra extension skeleton:
- Analyzer
- Exporter
- FileSystem
- Loader
- Plugin
The examples in the extension skeleton only appear to be a set of possible extension points. When turning on
TRACEin the log output of Ghidra, a detailed listing of extension point classes is shown. At the time of writing this blogpost, this consists of:
- TypeMapper
- FieldFactory
- VMInstruction
- Constraint
- FieldMouseHandler
- ChecksumAlgorithm
- FormatModel
- Analyzer
- Exporter
- DisassemblyInject
- ContentHandler
- ElfExtension
- DebuggerMappingOpinion
- PluginPackage
- FileSystem
- ProjectDataColumn
- PcodeStateInitializer
- Stringable
- DebuggerProgramLaunchOpinion
- RelocationFixupHandler
- CodeComparisonPanel
- DebuggerRegisterColumnFactory
- DebuggerClientFactory
- StringHandler
- AutoReadMemorySpec
- TableColumn
- ProgramCorrelator
- ProgramCorrelatorFactory
- Recognizer
- ElfInfoProducer
- ToolAssociation
- Initializer
- LanguageTranslator
- InstructionSkipper
- DebuggerBot
- GraphExporter
- Demangler
- DebuggerPcodeEmulatorFactory
- CoffRelocationHandler
- FileSystemModel
- BinaryAnalysisCommand
- DWARFFunctionFixup
- Loader
- TableRowMapper
- AddressCorrelatorFactory
- GhidraProtocolHandler
- GraphDisplayProvider
- LocationTrackingSpecFactory
- DataType
- DataTypeReferenceFinder
- AnnotationHandler
- ScriptProvider
- Decryptor
- DebuggerPlatformOpinion
- AddressCorrelator
- OverviewColorService
- DebuggerModelFactory
- LayoutProvider
- MachoRelocationHandler
- ColumnConstraintProvider
- Theme
- ElfRelocationHandler
- Validator
- Plugin
- RelocationHandler
It is not clear how many of these are actually meant for extension as a public interface and it’s entirely possible that everything that is not listed in the skeleton module is an unstable API, so if you decide to use any of these, be aware that you might run into potential issues.
For all extension points, it is generally true that they are accessible
to Ghidra as soon as they are available on the Java classpath. The
internal class loader will detect them and then search for classes that
implement extension points. That is theory, the practice is a little
more troublesome however. The most straightforward case is loading the
extension *.jar file from the classpath, which means you have to at
least have used gradle jar to build your extension. You can put the
jar file directly into the classpath or you can put a directory that
is one level below the extension root. This is an… interesting
choice, because it only works exactly one level below the extension
root from what we can tell and there are usually no interesting things
to include at this level (as in, no .class or .jar files), but
Ghidra will happily takes this path and then take any extension .jar
file within that project.
The way Ghidra scans the classpath here is, by checking one directory level above. If there is a
Module.manifest, it treats the directory as extension directory and then scans the directory for typical.jarplacement locations for extensions.
If we extend our run.sh script from above to include our extension
classpath (here we added the build subdirectory as classpath, which
doesn’t have any effect on the loaded classes itself, but will trigger
Ghidra to scan this directory for extension files). If you run
gradle jar and then ./run.sh, a Ghidra instance with your loaded
extension will start:
#!/bin/bash

# This is taken from the ghidraRun script and gives us the directory this
# script lives in. You should place it in your plugin root directory.
SCRIPT_FILE="$(readlink -f "$0" 2>/dev/null || readlink "$0" 2>/dev/null || echo "$0")"
SCRIPT_DIR="${SCRIPT_FILE%/*}"

java \
    -Djava.system.class.loader=ghidra.GhidraClassLoader \
    -Dfile.encoding=UTF8 \
    -Duser.country=US \
    -Duser.language=en \
    -Duser.variant= \
    -Dsun.java2d.opengl=false \
    -Djdk.tls.client.protocols=TLSv1.2,TLSv1.3 \
    -Dcpu.core.limit= \
    -Dcpu.core.override= \
    -Dfont.size.override= \
    -Dpython.console.encoding=UTF-8 \
    -Xshare:off \
    -Dsun.java2d.pmoffscreen=false \
    -Dsun.java2d.xrender=true \
    -Dsun.java2d.uiScale=1 \
    -Dawt.useSystemAAFontSettings=on \
    -Dlog4j.configurationFile="$GHIDRA_INSTALL_DIR/support/debug.log4j.xml" \
    -cp "$SCRIPT_DIR/build:$GHIDRA_INSTALL_DIR/Ghidra/Framework/Utility/lib/Utility.jar" \
    ghidra.GhidraLauncher ghidra.GhidraRun
Keep in mind that this will load your implemented extension points
directly, but won’t list the extension as an installed extension in
your project window. This works well when you don’t have an IDE, but
if you are writing Java, you are likely also using an IDE. If you are
using Eclipse, there’s the official Ghidra plugins, which hide all the
setup stuff we have listed here so far (but in case something breaks,
you can maybe debug with what we’ve shown here). If you are using
IntelliJ IDEA, then you can import the extension project like any other
gradle project. Instead of using the run.sh, you can now configure a
run configuration in IntelliJ with the following settings:
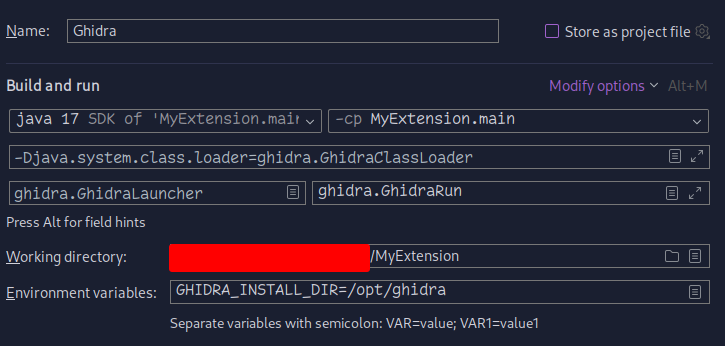
IntelliJ mostly guides you on how to set this up, when you select
MyExtension.main as module for the classpath. The rest of the options
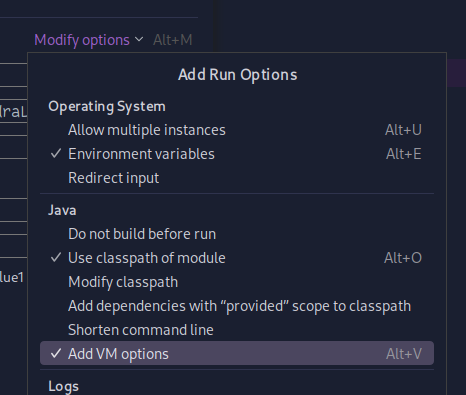
can be specified just like in run.sh. If you have trouble finding how
to add the VM options, these are hidden behind the Modify options
entry:
Using this configuration, IntelliJ generates the full classpath for you
based on the module itself. Why can’t we just point the classpath to
our compiled .class files outside of IntelliJ? The way this works in
the Ghidra class loader is that the things we specify in the classpath
will be loaded before anything else is loaded. If we therefore
point the classpath to our extension .class files directly, it will
try to load them before loading anything else and fail, because the
Ghidra loader has not loaded the Ghidra internal classes yet. It works
in IntelliJ, because IntelliJ kind of bypasses the Ghidra classloader
and just loads all dependent modules properly and puts their classpath
before our extension module when passing the classpath to Ghidra. We
didn’t put this into our run.sh script, because it’s a bit clunky
and we would have to regenerate the classpath when something changes,
which Intellij (and by extension also Eclipse) does automatically.
Activating Extensions in Ghidra
Something you need to be aware of is that while the extension points
are loaded automatically as soon as they are found by the class loader,
they might not actually appear enabled in the interface. For example,
while an Exporter will be immediately visible, an Analyzer is only
visible if its canAnalyze method returns true. So if you cannot
see your extension point available in the UI, make sure that all the
required conditions are fulfilled.
What we’ve found a bit tricky is activating a Plugin extension, i.e.
a GUI extension for a Tool. Normally, when installing an extension that
provides a Plugin, on first time load of the Decompiler you will be
prompted and asked to activate the plugin. During development, Ghidra
might fail to detect the availability of a new plugin (intentional or
unintentional, as you don’t want to get spammed with these dialogs
every time you start Ghidra), and you need to activate it manually.
Depending on which tool you are implementing the Plugin for, you need
to navigate to File/Configure from the top menu. The resulting dialog
should look something like this:
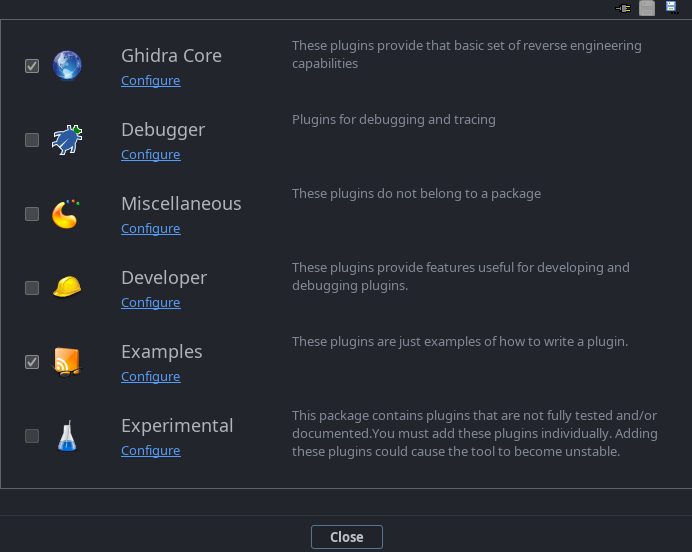
You can then navigate to the category you assigned to your plugin and activate it, by selecting the checkbox:

Closing Words
That’s about it. There are some things we haven’t covered (like defining new processors/architectures), which we might cover in the future when we need to work with it, but for now these are some points that we have encountered so far during development. If you spot any errors or things where you are like “wow these people are doing things so complicated, they could have just done X”, feel free to drop us a message. If you are interested in the Ghidra dark theme we’re using, you can check out the theme made by a colleague in our CTF team here.
Michael Pucher
Researcher
My research interests include systems security, malware analysis and embedded security, focusing on software reverse engineering and dynamic binary analysis.